Comparison Of Predicted Shear Rates And Stress Levels
In the conventional model, the thickness of the filter cake is areally uniform (at least locally); the entire fracture area continually experiences leakoff; and the leakoff rate decreases because of a steady growth in thickness of the filter cake. In the new model, the filter cake is areally heterogeneous; leakoff is significant only on the fracture area that is contacted by wormholes; and the global leakoff rate decreases because of a continual loss of fracture area that is contacted by wormholes.
In the conventional model, a single opening to flow exists that has a width (wc) that is equal to the fracture width minus twice the thickness of the filter cake at that point. The height of this opening is basically as high as the fracture. Thus, the flow opening is extremely high and narrow. In contrast, in the new model, for a given distance along the fracture, multiple flow channels exist (corresponding to the wormholes), the width of each channel (ww) could be only slightly less than the original fracture width, and the "height" of each channel is small compared to the total fracture height (but generally large compared to the fracture width).
Using the methods described in Transport Phenomenon (Bird, Stewart, and Lightfoot, 1960 or 2002), one can readily show that for a Newtonian fluid, the shear rate at the wall, g¢w, in a slit of width, w, is given by Eq. 1
and the average fluid velocity, uave, is given by Eq. 2
where dp/dl is pressure gradient along the fracture and mo is fluid viscosity. For power-law fluids, shear stress, txz, is given by Eq. 3:
the shear rate at the wall is given by Eq. 4:
and the average fluid velocity is given by Eq. 5:
K is the consistency index, and n is the power-law exponent. For both the Newtonian and power-law fluids, the shear stress at the wall, tw, is:
Eqs. 1-6 can be used to compare predictions from the conventional model and the new model.
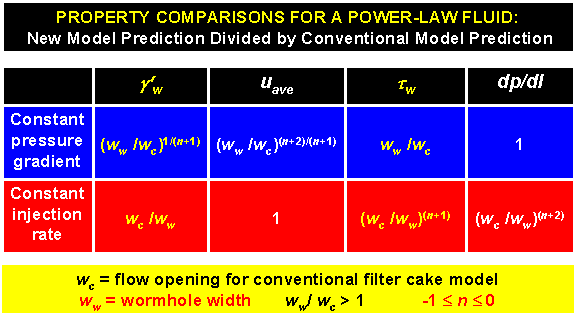
To make this comparison, consider the case where the two models are given the same total leakoff volume, and consequently, the same total volume of filter cake. Because the total fracture height is fixed, the total cross-section that remains open to flow must be the same for the two models. Based on Eqs. 1-6, the table above compares predictions (for a power-law fluid) for shear rate at the wall, average fluid velocity, shear stress at the wall, and pressure gradient from the two models. The listings compare predictions from the new model relative to those from the conventional model. Remember that ww /wc will always be greater than one—and usually much greater than one. Also, n is zero for a Newtonian fluid and could be –0.9 for a strongly shear-thinning fluid.
For a fixed pressure gradient, the new model predicts higher shear rates and shear stresses at the wall and much higher average fluid velocities than the conventional model. Therefore, greater erosion of the filter cake is predicted in the new model than in the conventional model.
In contrast, if the injection rate is held constant, the new model predicts much lower pressure gradients along the fracture than that predicted by the conventional model. Of course, the pressure gradient along the fracture impacts gel propagation and gel washout in water-shutoff treatments and fracture extension in hydraulic fracturing and produced water re-injection (i.e., by affecting the pressure at the fracture tip).