Do Hall Plots Indicate Selectivity During Gelant Placement?
(No.)
Hall plots are often used as a diagnostic method during gelant injection in field applications. In a Hall plot, the term,∑p+fDt, is plotted versus the cumulative injection volume, where p+f is the flowing wellhead pressure and Δt is time increment.15 Under steady-state or pseudo-steady-state conditions, the Hall plot should give a straight line with a slope,
where mHhas units of psi-D/B, m is viscosity in cp, re is external drainage radius in ft, s is skin factor, k is permeability in md, and h is formation thickness in ft. This slope, mH, gives the reciprocal of injectivity. Thus, Hall plots indicated changes in injectivity for wells. Furthermore, these injectivities reflect values that are averaged over all open zones. The Hall plot reveals nothing about whether a gelant or other injected fluid is penetrating selectively into one zone more than another.10 This point is made in Figs. 2 and 3 for unfractured and fractured wells, respectively. A more detailed discussion of this point can be found in Ref. 10.
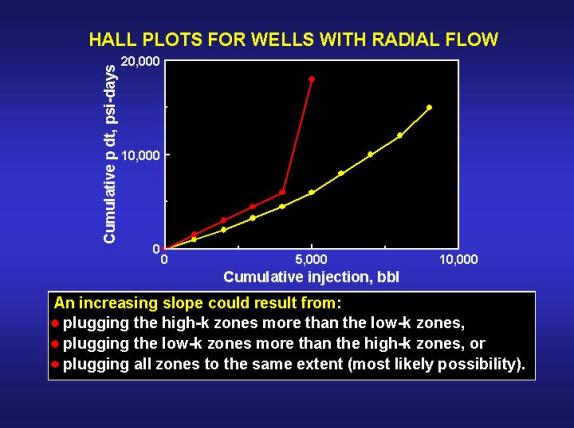
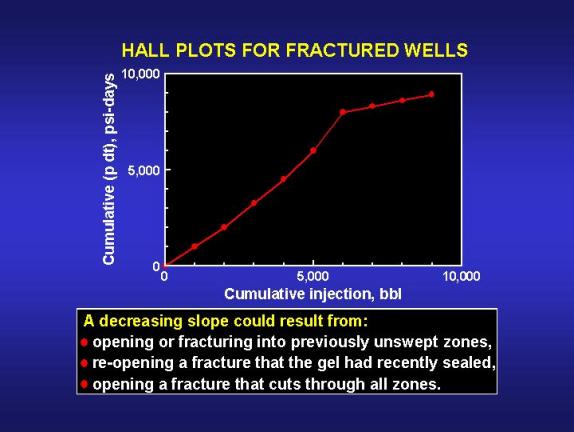
In summary, Hall plots may be a useful indicator of the overall pressure or rate of pressure increase in a well. However, they do not indicate whether the blocking agent is being placed in a beneficial or harmful manner.